#30DayMapChallenge · Day 17 · Light & dark · Tuesday 17 November 2026
45 days of flood reports, drawn as light
Single edition: light drawn on a dark ground is the Light & dark theme, so the Print and Dark editions show the same map.
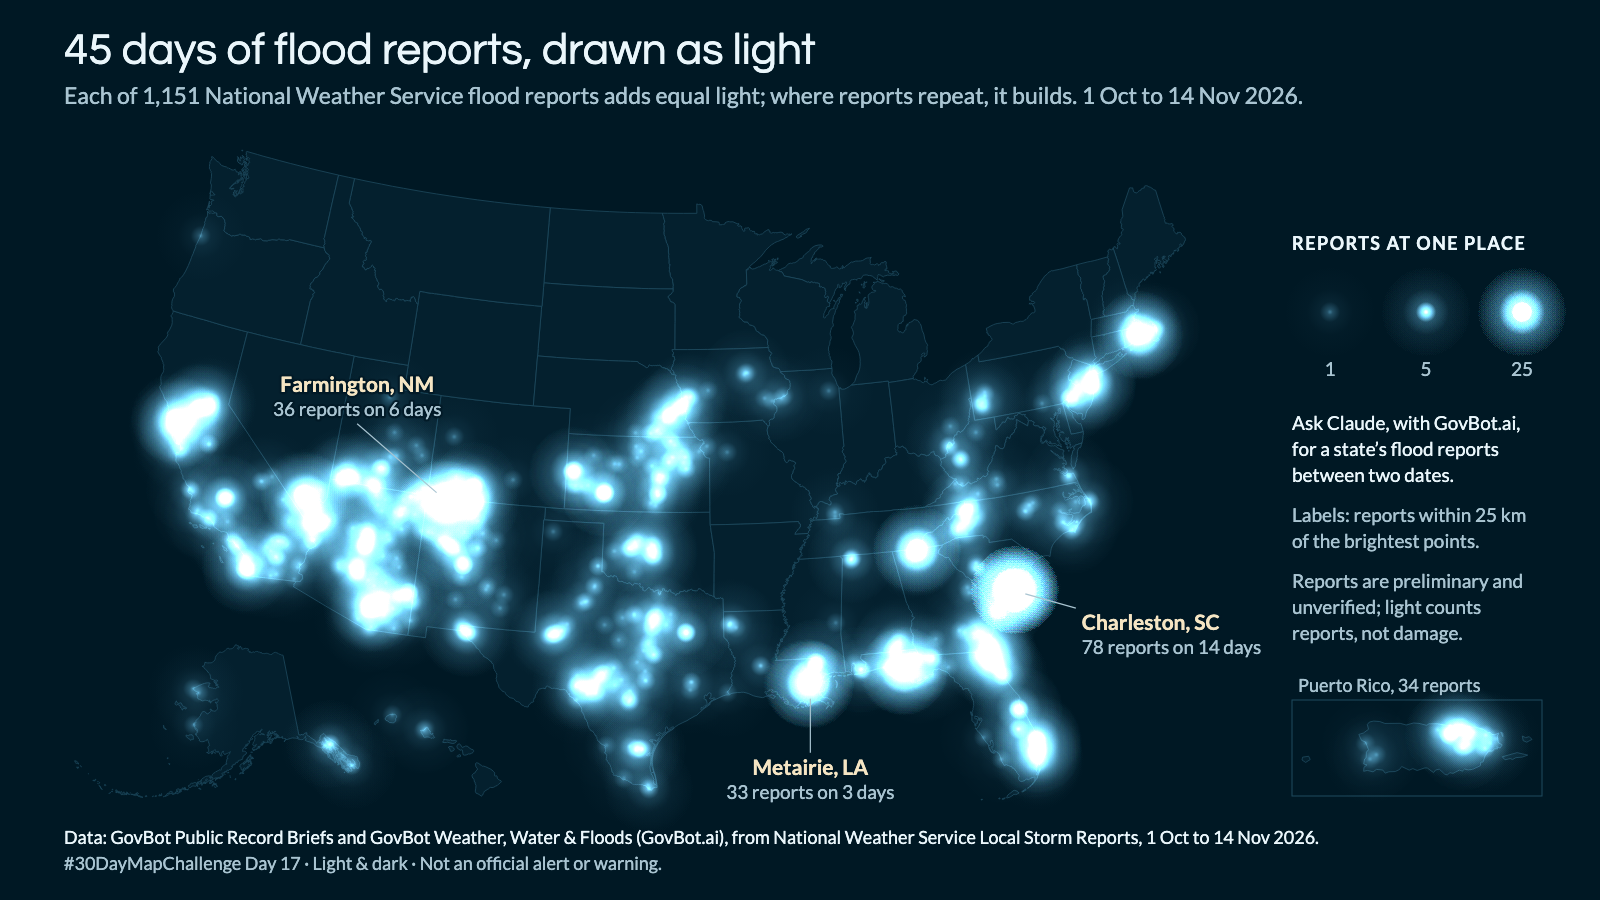
Animation: each report is lit at its UTC time; one second of video is five days. A thin ring marks each arrival and adds no light. 18 seconds, with sound; the player starts muted. Still image · Animation file (MP4)
Animation: each report is lit at its UTC time; one second of video is five days. A thin ring marks each arrival and adds no light. 18 seconds, with sound; the player starts muted. Still image · Animation file (MP4)
Which places in South Carolina had National Weather Service flood reports between 26 and 28 October 2026, and what did each report say?
In Claude, add "GovBot Weather, Water & Floods" or "GovBot Public Record Briefs" once, then turn it on in the chat. Every listing is at govbot.ai.
Data: GovBot Public Record Briefs and GovBot Weather, Water & Floods (GovBot.ai), from National Weather Service Local Storm Reports, 1 Oct to 14 Nov 2026.
How it was made: Data from the GovBot listing named above; map made with Claude, an AI model, and reviewed before publication. The animation shows the same records as the still image, and begins and ends on it.