GovBot.ai
All maps

Maps made with GovBot.ai

Each map is drawn from government public records that GovBot.ai brings into Claude and ChatGPT, one for each day of the #30DayMapChallenge, November 2026. Ask the same records your own questions in the AI app you already use. Free with the plan you already have; new sources are added as they clear review.

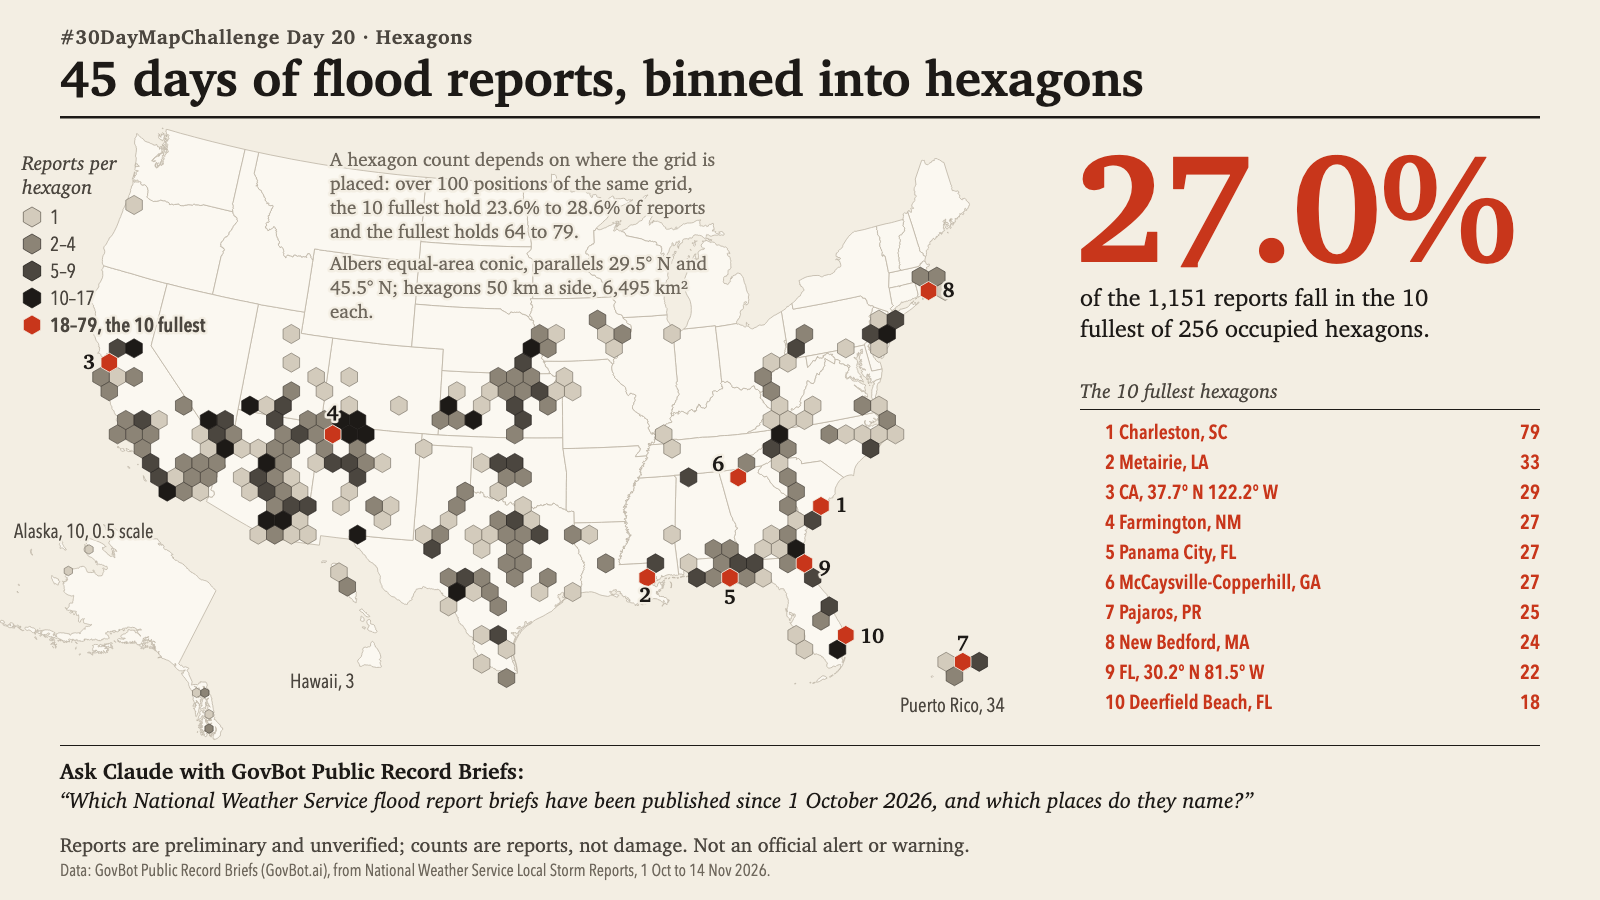
Print layout on a cream ground. Map of the conterminous United States with insets for Alaska (half scale in the wide image, 0.4 in the square), Hawaii and Puerto Rico. 1,151 National Weather Service flood reports from 1 October to 14 November 2026 are counted in hexagons 50 km a side on an Albers equal-area conic projection; 256 hexagons hold at least one report, shaded in four grey classes and vermilion: 1, 2 to 4, 5 to 9, 10 to 17, and 18 to 79. The 10 fullest hexagons are vermilion and numbered; together they hold 27.0% of the reports: 1 Charleston, SC, 79; 2 Metairie, LA, 33; 3 California at 37.7 N 122.2 W, 29; 4 Farmington, NM, 27; 5 Panama City, FL, 27; 6 McCaysville-Copperhill, GA, 27; 7 Pajaros, PR, 25; 8 New Bedford, MA, 24; 9 Florida at 30.2 N 81.5 W, 22; 10 Deerfield Beach, FL, 18. Most occupied hexagons lie across the Southwest, Texas, the Gulf Coast and the Southeast; the northern plains have none. A note states that the counts depend on where the grid is placed: over 100 positions of the same grid the 10 fullest hold 23.6% to 28.6% and the fullest holds 64 to 79. Reports are preliminary and unverified. Not an official alert or warning. The headline figure, 27.0% in large vermilion type, reads: of the 1,151 reports fall in the 10 fullest of 256 occupied hexagons.
Print layout on a cream ground. Plan view, north up, of a half-mile circle centred on 30.4515 N, 91.1871 W in downtown Baton Rouge, Louisiana, with rings at 0.1-mile steps, a north arrow and a 400 m scale bar. The 74 EPA ECHO facility records are drawn in vermilion by program: water discharge (NPDES, circles) 40, hazardous waste (RCRA, triangles) 27, air and hazardous waste (diamond) 1, air (Clean Air Act, squares) 2, greenhouse gas reporting (crosses) 3, no program listed (open ring) 1, and hexagons for more than one program at one coordinate. Filled marks are located under 1 km (56); open outlines are 1 km or coarser (18). A circled marker about 0.2 mile north-east of the centre is labelled 18 records at one coordinate; numerals 4 and 5 beside two hexagons give records at one coordinate. The headline figure, 74 in large vermilion type, reads: records in EPA ECHO within 0.5 mile of the centre, by program, at the coordinates EPA publishes. Compliance status in ECHO, all 74 records: No Violation Identified 31, No status returned 43. Printed: A record in an EPA program is not a finding of violation.
Print layout on a cream ground. Map of the United States with Alaska and Hawaii placed below the lower 48, showing public-record briefs from 1 October to 14 November 2026. Each dark dot is one brief; each vermilion ring around it is one record the brief looked for and did not find, so briefs with one ring are scattered across the country and briefs with several concentric rings sit in the Boston area, California, Colorado and Alaska. The headline figure, 28 in large vermilion type, reads: public-record briefs, 1 Oct to 14 Nov 2026; each dot one brief, each ring one record not found. Three examples are named from the briefs: an M5.5 earthquake 92 km NNW of Aleneva, Alaska, not found: landslide inventory records within 25 km; flood reports across western and central Kansas, not found: IPAWS archived flood alerts for the UTC day; and DR-4945 Severe Storms, Straight-line Winds, Tornadoes, Flooding, and Landslides (OH), not found: Public Assistance projects, DR-4507. A note says 11 briefs with no single place or outside this projection (Guam, recalls, notices) are not on the map, 13 absences. Printed: Not an official alert or warning.
Dark map of the United States with Alaska, Hawaii and a Puerto Rico inset. Each of 1,151 National Weather Service flood reports from 1 October to 14 November 2026 is drawn as an equal faint blue glow, so places with repeated reports build up to white. The brightest areas are labelled: Charleston, SC, 78 reports within 25 km on 14 days; Farmington, NM, 36 reports on 6 days; Metairie, LA, 33 reports on 3 days. Most light falls across the Southwest, the Gulf Coast and the Southeast coast; the northern plains stay dark. A legend shows the glow of 1, 5 and 25 reports at one place.
Print layout on a cream ground. Map of North Carolina with National Weather Service flood records from 25 to 30 September 2024, one mark per record at its reported begin point. Solid vermilion circles, sized by property damage estimate, are records in counties FEMA designated under major disaster declaration DR-4827 and cluster in the western mountains; open diamonds are records in counties not designated, in the central and eastern parts of the state. Labels: Buncombe, 24 deaths, $600 million; Yancey, 13 deaths, $95.1 million; Henderson, 7 deaths, $201 million; Watauga, 2 deaths, $250 million. The headline figure, 67 in large vermilion type, reads: direct deaths in these NWS flood records, all recorded in counties that FEMA designated under DR-4827, and all but $107,000 of the $1.96 billion in NWS property damage estimates. A ledger names 28 counties in both records, 12 areas in the FEMA declaration only (11 counties and the Eastern Band of Cherokee Indians tribal area) and 13 counties with an NWS flood record only. A note says FEMA-only areas have no NWS flood record in these dates and the NWS-only records carry $107,000 in estimates and no deaths. Printed: Not an official alert or warning.
Print layout on a cream ground. Map of the United States on which communities named in FEMA flood map notices from 1 October to 14 November 2026 are drawn as small marks grouped at the centre of each of 37 states; position within a state is not a location. Open circles mark proposed maps (189 communities, 8 notices, comments close 12 January or 11 February 2027), solid dark circles final maps (124, 5 notices, new maps set to take effect 22 January to 16 March 2027) and vermilion-tinted diamonds revised maps through letters of map revision (183, 6 notices). The headline figure, 496 in large vermilion type, reads: communities in 37 states, named in notices published in the Federal Register, 1 October to 14 November 2026. Labelled state totals: Missouri 91, Florida 53, California 34, New York 33, Michigan 30, Texas 28, Colorado 27, Vermont 24, Iowa 21, Arizona 19, Illinois 18, North Carolina 17, Nebraska 12, Kansas 11 and Idaho 9. Notices were published 14 October and 13 November. Printed: Not an official alert or warning.
Print layout on a cream ground. Plan view, north up, of a 1 km dashed circle around 39.2014, -85.9214 in Columbus, Indiana, with a 500 m scale bar and north arrow. Fourteen numbered National Wetlands Inventory polygons are drawn from their outlines, each type with its own hatch or dot pattern: riverine, forested or shrub wetland, pond and lake. Riverine polygon 1, R2UBH, is outlined in vermilion and runs from the north-west to the southern edge of the frame. The headline figure, 404 m in large vermilion type, reads: from the point to the edge of polygon 1, Riverine (R2UBH). A table lists number, Cowardin code, type, acres and nearest-edge distance in metres, from polygon 1 (5,027.02 acres, 404 m) to polygon 14, PUBK pond (1.48 acres, 949 m); polygon 12 is lake L1UBHx, 41.03 acres, 857 m. An inset enlarges a 160 m by 118 m stretch of polygon 6 seven times and marks each vertex: 33 in this stretch, 1,117 in the whole map, from 77,356 vertices in the full source outlines. Printed: NWI maps are not a wetland delineation or a jurisdictional determination; imagery 2005.
Print layout on a cream ground. Map of the Northridge and San Fernando area of California with a 10 km scale bar. Grey circles sized by magnitude mark 17 epicentres of the 20 largest catalogued earthquakes within 40 km of the 1994 Northridge epicentre, each with a dashed 5 km circle; the 1994 Northridge epicentre, number 1, is vermilion. Black triangles mark landslide-inventory records, and lines join each epicentre to its nearest record, labelled in km where longer than 0.9 km; the line from number 1 is vermilion, 6.09 km. The headline figure, 0 in large vermilion type, reads: landslide records within 5 km of the 1994 M6.7 Northridge epicentre (number 1); the nearest is 6.09 km away. A table lists each epicentre with date, magnitude, a bar and count of records within 5 km (0 to 2,994) and the distance to the nearest record; counts include 92 for 1971-02-09, 2,726 for 1994-01-18 and 2,994 for 1995-06-26, and two epicentres show none within 5 km. A note says the five records nearest the 1893 M5.8 epicentre near Newhall (0.15 to 0.24 km) are dated 1994-01-17 in the inventory, 100 years after the event. Printed: Proximity on a map is not cause; Not an official alert or warning.
Print layout on a cream ground. Map of Texas with the 188 power plants of 300 MW or more (128,155 MW, 62.5% of the state total) at EIA-reported coordinates, each with a symbol for its main fuel and area proportional to nameplate MW. Wind (triangles), solar (diamonds) and energy storage (squares) are in vermilion tones; natural gas (circles), coal (hexagons), nuclear (star) and petroleum (ring) are grey or black. Wind plants concentrate in West Texas and the Panhandle, solar in West and North Central Texas, and natural gas around Houston and Dallas-Fort Worth. The headline figure, 47.1% in large vermilion type, reads: wind, solar and energy storage, 96,580 MW of 204,906 MW nameplate capacity, EIA inventory for August 2026. A stacked bar and list give capacity by fuel for all 1,095 Texas plants in MW: wind 44,512, solar 33,659, energy storage 18,410, natural gas 84,133, coal 16,582, nuclear 5,139, petroleum 884, hydroelectric 735, other 491, biomass and waste 363. Labelled plants: Great Prairie Wind 1,027 MW, Hecate Energy Longhorn Solar LLC 650 MW, W A Parish 4,008 MW (coal and natural gas), SAHARA BESS (SOHO BESS) 409 MW (energy storage) and South Texas Project 2,709 MW (nuclear).
Print layout on a cream ground. Map of Long Island Sound between Connecticut and Long Island, New York, with five NOAA tide stations drawn as grey circles sized by observed tidal range on 11 November 2026, the westernmost, Kings Point, in vermilion: Montauk 2.25 ft, New London 2.65 ft, New Haven 6.37 ft, Bridgeport 6.96 ft, Kings Point 7.38 ft. The headline figure, 3.28 in large vermilion type, reads: times as large; observed tidal range rose from 2.25 ft at Montauk to 7.38 ft at Kings Point. Beside the map, one water-level curve per station from east to west, in feet above Mean Lower Low Water over the local day (EST): observed six-minute values as a solid line, hourly predictions as a dashed line, with a line joining the predicted high waters. Highs: Montauk 3.15 ft, New London 3.66, New Haven 7.29, Bridgeport 7.92, Kings Point 8.35. A subtitle gives the predicted morning high water as Montauk 09:50 and Kings Point 12:09, 2 h 19 min later. Printed: Datum MLLW; Not an official alert or warning.
Print layout on a cream ground. Map of the United States with Alaska and Hawaii insets and five territory panels, marking significant earthquakes from 1 January to 18 November 2026 with vermilion circles sized by magnitude: solid for epicentres inside a state, open rings for offshore events with the nearest place named. The headline figure, 35 in large vermilion type, reads: earthquakes of USGS significance 600 or more, 1 January to 18 November 2026, sized by magnitude. Numbers on the map give each event's rank. A ranked list gives the largest: M6.5, 170 km W of Nikolski, Alaska (offshore); M6.4, 223 km ESE of Attu Station, Alaska; M6.3, 92 km SSW of Nikolski; M6.0 off the coast of Oregon; M6.0, 13 km S of Honaunau-Napoopoo, Hawaii; and so on to rank 11, M5.0, 38 km SSE of Spearman, Texas, and rank 35, M2.4, 8 km NE of Bel Air North, Maryland. Inside a state: California 10, Alaska 4, Nevada 3, Washington 3, Hawaii 2, 8 more states 1 each; offshore 5. Event 35 drew 398 felt reports. Puerto Rico, the U.S. Virgin Islands, Guam, the Northern Mariana Islands and American Samoa show 0 events. A caption quotes the single prompt the map was made from. Printed: Not an official alert or warning.
Print layout on a cream ground. Choropleth map of the 16 census tracts of Bartholomew County, Indiana, shaded by structure records per square kilometre of land: vermilion for 250 or more (6 tracts), light vermilion for 100 to under 250 (3 tracts), then dark grey 50 to under 100 (1 tract), light grey 20 to under 50 (3) and white under 20 (3). Each tract is labelled with its number and value. A boxed enlargement shows the eight smallest tracts at the centre: 102 (455), 105 (421), 101 (390), 106 (378), 107 (317), 103 (281), 104 (212) and 108 (166). Tract 109 has 108 and tract 111.01 has 51; the rural tracts run from 25 (110) down to 11 (111.02). The headline figure, 45% in large vermilion type, reads: of the 37,380 structure records in Bartholomew County are in 9 of its 16 tracts, on 6.7% of its land. A dashed legend line marks the 100 records per km2 threshold for urban and rural, which is not the Census urban-area class. A note says the 7 rural tracts hold 92% of the 4,210 agricultural records, 5.0% to 30% of each rural tract's records. Scale bars of 10 km and 2 km and a north arrow are shown.
Print layout on a cream ground. Small map of Harris County, Texas, outlined in black among labelled neighbouring counties (Montgomery, Liberty, Chambers, Galveston, Brazoria, Fort Bend, Waller), marked 639 actions. The headline figure, 162 in large vermilion type, reads: actions name Hurricane, of the 639 actions documented in the county's 2025 multi-jurisdictional plan update. A table lists actions by hazard (rows) and type (columns), with circles sized by count; the Hurricane row is in vermilion: structure and infrastructure 61, mixed types 67, education and awareness 18, plans and regulations 1, no type recorded 15, naming the hazard 162. Other rows: inland flooding 158, cold wave 111, heat wave 108, wildfire 87, drought 82, earthquake 78, tsunami 76, dam or levee failure 75, erosion or subsidence 75. Totals by type: 99, 78, 27, 15, natural systems 2, no type recorded 418; 639 in all. Two quotations from the plan are given with page references, from Jersey Village city (Vol. 2.2, p. 81) and Katy city (Vol. 2.2, p. 156). The FEMA registry, 17 Oct 2026, lists the plan as approved 16 Apr 2026, expiring 15 Apr 2031, with 13 of 42 listed jurisdictions approvable pending adoption. A note says the index records the status of all 639 actions as cannot tell and that a listed action is a documented intention, not a funded or approved project. Printed: Not an official alert or warning.
Print layout on a cream ground. Outline of Indiana with a marker and label at Bartholomew County, with the note that the point is the Census interior point and ACS 2023 gives population 82,881 and median household income $80,365. Four record groups sit beside it, each with its own source and date. The headline figure, 13 in large vermilion type, reads: FEMA declarations; newest: emergency declaration, flood, 15 Aug 2026. A timeline of the 10 newest declarations marks 5 major and 5 emergency. Mitigation planning: Bartholomew County 2025 Hazard Mitigation Plan, approved 5 Feb 2025, expires 4 Feb 2030, 7 member jurisdictions, 35 action rows (flood 14, earthquake 9, dam and levee 9, wind 8). Flood context: 5 of 7 communities in the NFIP, with Elizabethtown and Hartsville not participating; CRS Bartholomew County class 8, Columbus class 7; 31 multiple-loss properties flagged, 30 NFIP repetitive loss. Resilience: 22.5 percentile on the Community Resilience Challenges Index; below poverty level 12.0%, without health insurance 5.2%, age 25+ without diploma 7.9%. Printed: Not an official alert or warning.
Map of Bartholomew County, Indiana, drawn in the style of an engraved nineteenth-century county map on sepia paper, with a graduated degree border, a north arrow, a scale in statute miles and a title cartouche reading Floods of Record. Rivers and town limits are drawn in fine line. NOAA Storm Events flood records from 1996 to 2025 are plotted where they carry coordinates: circles for floods, triangles for flash floods, sized by recorded property damage, with a dagger beside the four records that list a direct death. Two large red marks near Columbus are the June 2008 East Fork White River flood ($150,000,000) and the Haw Creek flash flood ($100,000,000), which together hold 99.6% of the $251.0 million recorded property damage. A side table lists the five largest property-damage records, and the question used to obtain the records is printed beside the map.
Print layout on a cream ground. Map of the United States showing 48 current interagency wildfire perimeters on 18 November 2026, drawn as circles at each fire's origin with area proportional to perimeter acres, on states shaded tan where a record exists. Solid vermilion circles are below 100 percent contained (19), open vermilion rings are reported 100 percent contained (18) and dashed rings have no containment reported (11). Black squares mark 6 records placed by perimeter extent because the origin point was blank (3) or outside its state (3). The headline figure, 48 in large vermilion type, reads: current interagency fire perimeters in 18 states on 18 November 2026; 34 of the 52 places queried (50 states, DC and Puerto Rico) returned none. Labelled fires: Grasshopper 93,971 acres, 98% contained; Hagen 61,380, 99%; Aspen Acres 102,004, 96%, the largest perimeter, Custer County, Colorado; Timber 25,350, 100%; Snyder 18,123, 100%; Craig Lake Fire 604, 100%; Wild River 817, 59%; Shady Hollow 2,787, 0%, the largest found in November, Logan County, Arkansas, found 16 November. 8 of the 48 were found in November. Printed: Perimeters are provisional. Not an official alert or warning.
Print layout on a cream ground. Map of the lower 48 states with Alaska and Hawaii insets showing National Weather Service flood, flash flood and coastal flood reports from 1 October to 13 November 2026. Reports in a cluster are solid vermilion dots; other reports are hollow grey dots; a vermilion ring sized by report count marks each cluster, and labels give state and cluster days, led by AZ 4, with CA 3, FL 3, LA 2, NM 2, TX 2 and single cluster days in GA, KS, MA, NE, NV, NC, OK, SC and UT. The headline figure, 25 in large vermilion type, reads: state-days met the cluster rule and held 585 of 1,151 reports, in 15 states. The rule is one state and one UTC day with 15 or more reports. A bar chart of reports per UTC day shades the cluster share in vermilion; the peak day is 128 reports. The largest clusters are KS on 1 Oct with 50 reports, CA on 13 Nov 47, AZ on 1 Nov 44, TX on 1 Oct 34, CA on 11 Oct 27 and GA on 5 Nov 27. A note says GovBot Weather, Water & Floods returned 27 reports for Georgia on 5 November, all matching the mapped layer. Puerto Rico's 34 reports, none in a cluster, are not drawn. Printed: Reports are preliminary and unverified; Not an official alert or warning.
Print layout on a cream ground. Choropleth map of Colorado's 64 counties in five classes of wildfire likelihood, the national percentile rank of mean annual burn probability: vermilion for 90 and above, then dark grey, mid grey, light grey and white for 80 to under 90, 70 to under 80, 50 to under 70 and under 50. The headline figure, 9 in large vermilion type, reads: of Colorado's 64 counties are in the highest class, 90 and above. The nine vermilion counties lie along the Front Range and are labelled with leader lines: Larimer 91.8, Boulder 95.7, Gilpin 92.6, Clear Creek 91.5, Jefferson 96.7, Douglas 96.4, El Paso 92.0, Teller 97.6 and Fremont 90.8. The legend counts 9 counties at 90 and above, 11 at 80 to under 90, 13 at 70 to under 80, 19 at 50 to under 70 and 12 under 50. Printed: Not an official alert or warning.
Print layout on a cream ground. Map of central Philadelphia and the New Jersey side of the river inside a 15 km circle outlined in vermilion around 39.95, -75.16, with a scale bar, a north arrow and a small locator map of Pennsylvania, New Jersey and Delaware. Major pipeline routes are drawn as black lines inside the circle and grey outside it, each operator in its own dash pattern; most lines run through south and southwest Philadelphia and along the New Jersey side to the southeast. The headline figure, 233.2 km in large vermilion type, reads: of major pipeline from 6 operators lies within 15 km of central Philadelphia, as compiled by the EIA in January 2020. A table lists kilometres in the circle: Sunoco, petroleum products (6 lines), 69.5; Transcontinental Gas PL, natural gas, 63.3; COLONIALPIPELINE CO, petroleum products, 56.1; BUCKEYE PARTNERS, petroleum products (2 lines), 28.1; Texas Eastern Trans Co, natural gas, 13.7; Columbia Gas Trans Co, natural gas, 2.5; all operators 233.2. A note says routes are generalized at 1:1,000,000 scale or coarser and are not for locating a line on the ground, and that excavators use the 811 call-before-you-dig system.
Print layout on a cream ground. Map of the United States with one point for each area FEMA designated in a disaster declaration made from 1 October to 14 November 2026. Open vermilion rings mark major disaster declarations (11 declarations, 43 areas), solid vermilion diamonds emergency declarations (6, 120 areas) and triangles fire management declarations (2, 2 areas). The headline figure, 165 in large vermilion type, reads: designated areas, one point per area, in 19 declarations across 15 states and territories. A sentence below says Hurricane Isaias accounts for 122 of the 165 areas, in 4 declarations. A dense band of diamonds runs through Georgia (EM-3657-GA, 76) and along the Florida panhandle and southern Alabama; smaller groups sit in Ohio, West Virginia, Wisconsin, New Hampshire, Oklahoma, New Mexico, Utah, Nevada, California and Hawaii, and an inset shows Guam and the Northern Mariana Islands. Each point carries its declaration number and area count. A list gives the declaration dates from 2 October to 27 October. A note says points are area centroids, not incident locations. Printed: Not an official alert or warning.

November 2026

Play the month shows every map in date order, from the earliest.

Sun
Mon
Tue
Wed
Thu
Fri
Sat
1PointsDay 1: FEMA disaster declarations, 1 October to 14 November 2026FEMA disaster declarations, 1 October to 14 November 2026
Animated
2LinesDay 2: Who operates the major pipelines within 15 km of PhiladelphiaWho operates the major pipelines within 15 km of Philadelphia
Animated
3PolygonsDay 3: Colorado counties by wildfire likelihoodColorado counties by wildfire likelihood
Animated
4ClustersDay 4: Clusters of NWS flood reports, 1 Oct to 13 Nov 2026Clusters of NWS flood reports, 1 Oct to 13 Nov 2026
Animated
5Senses: SightDay 5: Active wildfire perimeters in the public recordActive wildfire perimeters in the public record
Animated
6VintageDay 6: Floods of Record in Bartholomew County, IndianaFloods of Record in Bartholomew County, IndianaSingle edition
Animated
710 minute mapDay 7: Bartholomew County, Indiana: a hazard profile made in ten minutesBartholomew County, Indiana: a hazard profile made in ten minutes
Animated
8UtopiaDay 8: Mitigation actions in Harris County’s hazard mitigation planMitigation actions in Harris County’s hazard mitigation plan
Animated
9Urban-ruralDay 9: Structure records per km² of land, by census tract, Bartholomew County, IndianaStructure records per km² of land, by census tract, Bartholomew County, Indiana
Animated
10Prompting onlyDay 10: Significant earthquakes in the United States, 2026Significant earthquakes in the United States, 2026
Animated
11Senses: SoundDay 11: The tide on Long Island Sound, 11 November 2026The tide on Long Island Sound, 11 November 2026
Animated
12PowerDay 12: Power in Texas: generating capacity by fuelPower in Texas: generating capacity by fuel
Animated
13InteractionsDay 13: Landslide records near large earthquakesLandslide records near large earthquakes
Animated
14Borgesian mapDay 14: Every mapped wetland within 1 km of one point in Columbus, IndianaEvery mapped wetland within 1 km of one point in Columbus, Indiana15Inside outDay 15: Communities named in FEMA flood map notices, 1 October to 14 November 2026Communities named in FEMA flood map notices, 1 October to 14 November 2026
Animated
16Collaborative mapDay 16: Hurricane Helene in North Carolina: FEMA declarations and NWS flood recordsHurricane Helene in North Carolina: FEMA declarations and NWS flood records
Animated
17Light & darkDay 17: 45 days of flood reports, drawn as light45 days of flood reports, drawn as lightSingle edition
Animated
18NULLDay 18: Records the public-record briefs looked for and did not findRecords the public-record briefs looked for and did not find
Animated
19Senses: SmellDay 19: EPA facility records within half a mile of downtown Baton RougeEPA facility records within half a mile of downtown Baton Rouge
Animated
20HexagonsDay 20: 45 days of flood reports, binned into hexagons45 days of flood reports, binned into hexagons
21OpenStreetMapMap to come
22ProjectionsMap to come
23Senses: TasteMap to come
24NetworkMap to come
25Is this a map?Map to come
26WaterMap to come
27New toolMap to come
28Senses: FeelingMap to come
29RasterMap to come
30Pen & paperMap to come

Add it once

Claude: Settings, Connectors, then the GovBot listing in the connector directory. ChatGPT: search the plugin directory for the GovBot listing.

Turn it on in the chat

In Claude, switch the listing on in the chat. In ChatGPT, type @ in a new chat and choose it. Developers can use the same Claude listings in Claude Code.

Ask in plain language

Ask in plain language. Check the sources, record dates and stated limits in the answer.