#30DayMapChallenge · Day 6 · Vintage · Friday 6 November 2026
Floods of Record in Bartholomew County, Indiana
Single edition: the engraved survey-sheet look is the Vintage theme, so the Print and Dark editions show the same map.
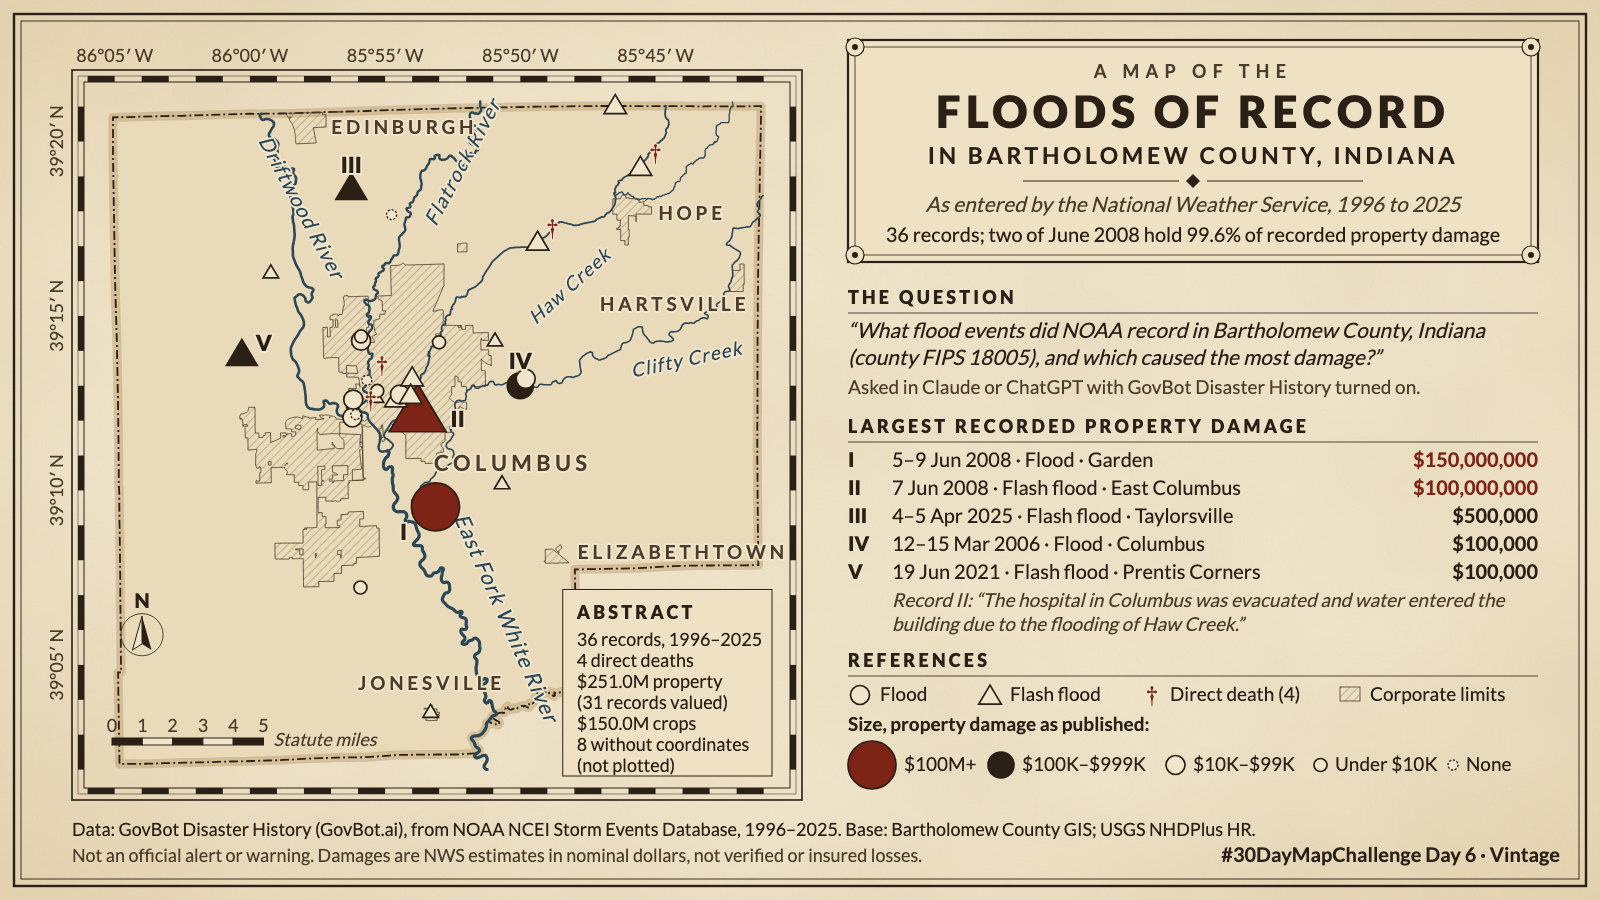
Animation: each NOAA flood record appears on its begin date; one second of video is three years. Records without coordinates appear only as ticks on the time line. 19 seconds, with sound; the player starts muted. Still image · Animation file (MP4)
Animation: each NOAA flood record appears on its begin date; one second of video is three years. Records without coordinates appear only as ticks on the time line. 19 seconds, with sound; the player starts muted. Still image · Animation file (MP4)
What flood events did NOAA record in Bartholomew County, Indiana (county FIPS 18005), and which caused the most damage?
In Claude, add "GovBot Disaster History"; in ChatGPT, add "GovBot Disaster History" once, then turn it on in the chat. Every listing is at govbot.ai.
Data: GovBot Disaster History (GovBot.ai), from NOAA NCEI Storm Events Database, 1996–2025. Base: Bartholomew County GIS; USGS NHDPlus HR.
How it was made: Data from the GovBot listing named above; map made with Claude, an AI model, and reviewed before publication. The animation shows the same records as the still image, and begins and ends on it.