GovBot.ai
All maps

#30DayMapChallenge · Day 7 · 10 minute map · Saturday 7 November 2026

Bartholomew County, Indiana: a hazard profile made in ten minutes
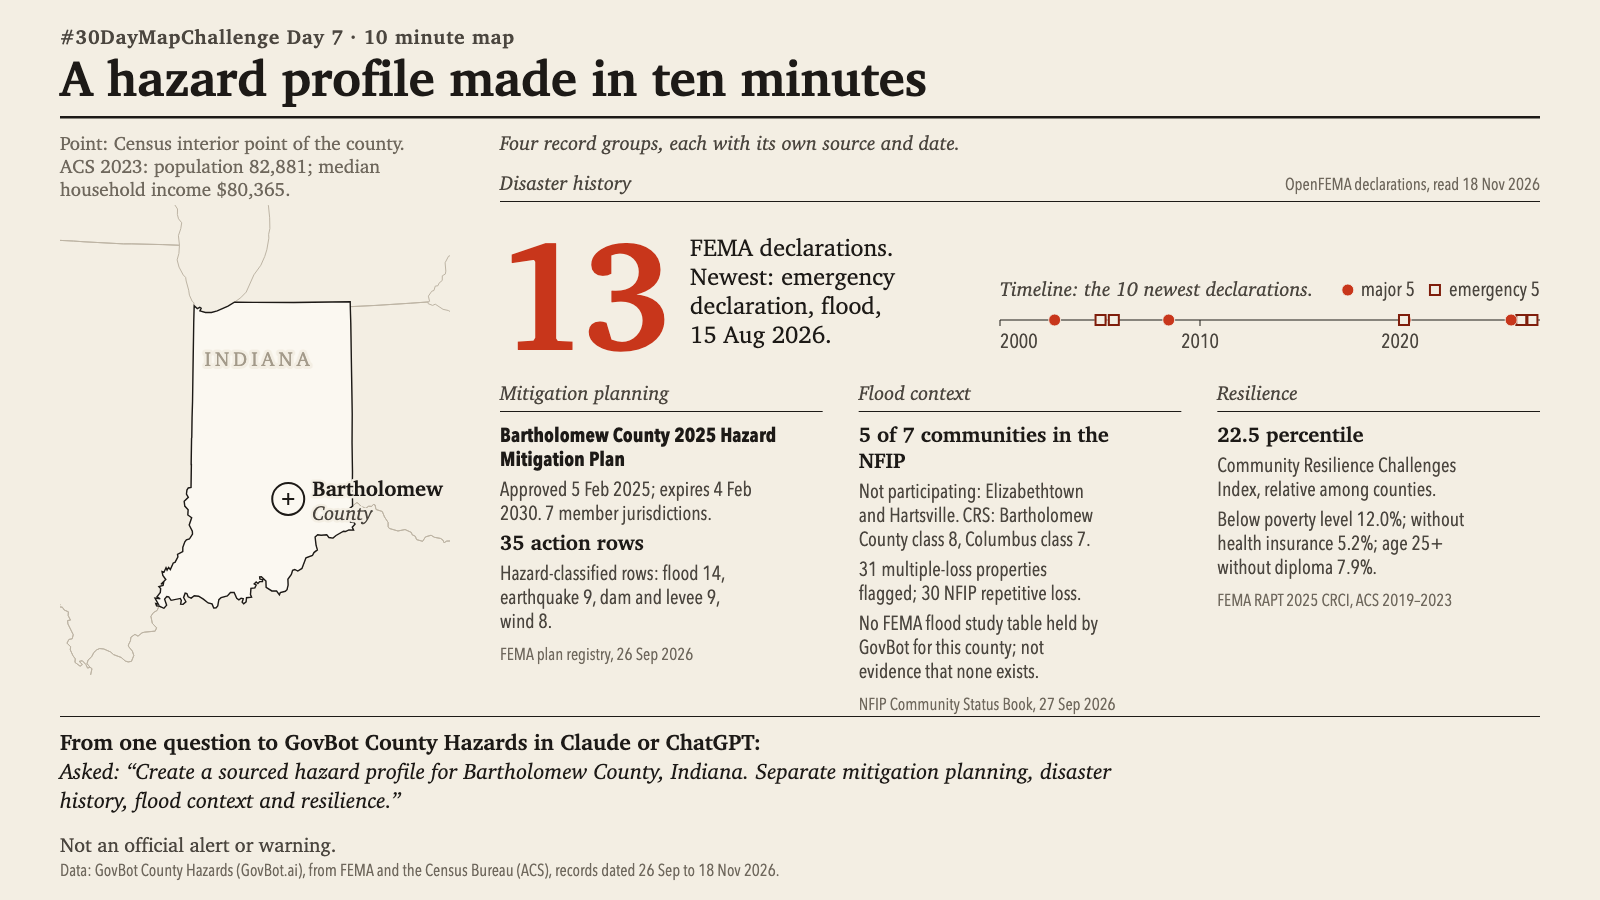
Print layout on a cream ground. Outline of Indiana with a marker and label at Bartholomew County, with the note that the point is the Census interior point and ACS 2023 gives population 82,881 and median household income $80,365. Four record groups sit beside it, each with its own source and date. The headline figure, 13 in large vermilion type, reads: FEMA declarations; newest: emergency declaration, flood, 15 Aug 2026. A timeline of the 10 newest declarations marks 5 major and 5 emergency. Mitigation planning: Bartholomew County 2025 Hazard Mitigation Plan, approved 5 Feb 2025, expires 4 Feb 2030, 7 member jurisdictions, 35 action rows (flood 14, earthquake 9, dam and levee 9, wind 8). Flood context: 5 of 7 communities in the NFIP, with Elizabethtown and Hartsville not participating; CRS Bartholomew County class 8, Columbus class 7; 31 multiple-loss properties flagged, 30 NFIP repetitive loss. Resilience: 22.5 percentile on the Community Resilience Challenges Index; below poverty level 12.0%, without health insurance 5.2%, age 25+ without diploma 7.9%. Printed: Not an official alert or warning.

Animation: the four sections of the profile appear in reading order, then the disaster timeline marks appear oldest first along their axis. The section order is a reading order, not a sequence in time; nothing moves. 18 seconds, with sound; the player starts muted. Still image · Animation file (MP4)
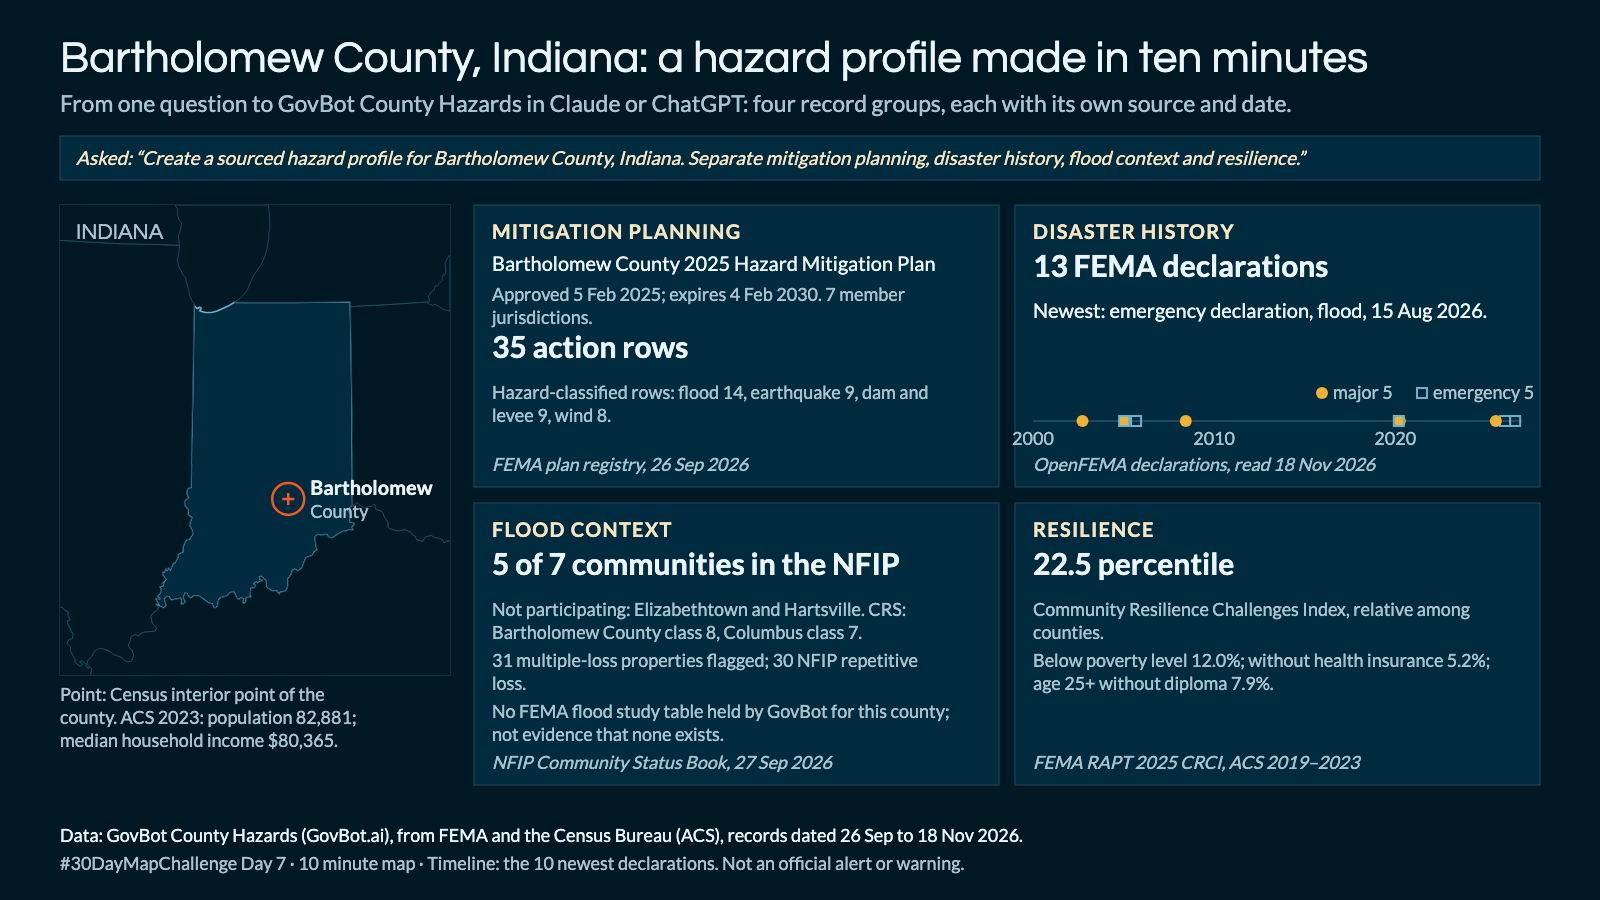
Animation: the four sections of the profile appear in reading order, then the disaster timeline marks appear oldest first along their axis. The section order is a reading order, not a sequence in time; nothing moves. 18 seconds, with sound; the player starts muted. Still image · Animation file (MP4)

Create a sourced hazard profile for Bartholomew County, Indiana. Separate mitigation planning, disaster history, flood context and resilience.

In Claude, add "GovBot County Hazards"; in ChatGPT, add "GovBot County Hazards" once, then turn it on in the chat. Every listing is at govbot.ai.

Data: GovBot County Hazards (GovBot.ai), from FEMA and the Census Bureau (ACS), records dated 26 Sep to 18 Nov 2026.

How it was made: Data from the GovBot listing named above; map made with Claude, an AI model, and reviewed before publication. The animation shows the same records as the still image, and begins and ends on it.

Add it once

Claude: Settings, Connectors, then the GovBot listing in the connector directory. ChatGPT: search the plugin directory for the GovBot listing.

Turn it on in the chat

In Claude, switch the listing on in the chat. In ChatGPT, type @ in a new chat and choose it. Developers can use the same Claude listings in Claude Code.

Ask in plain language

Ask in plain language. Check the sources, record dates and stated limits in the answer.