GovBot.ai
All maps

#30DayMapChallenge · Day 11 · Senses: Sound · Wednesday 11 November 2026

The tide on Long Island Sound, 11 November 2026
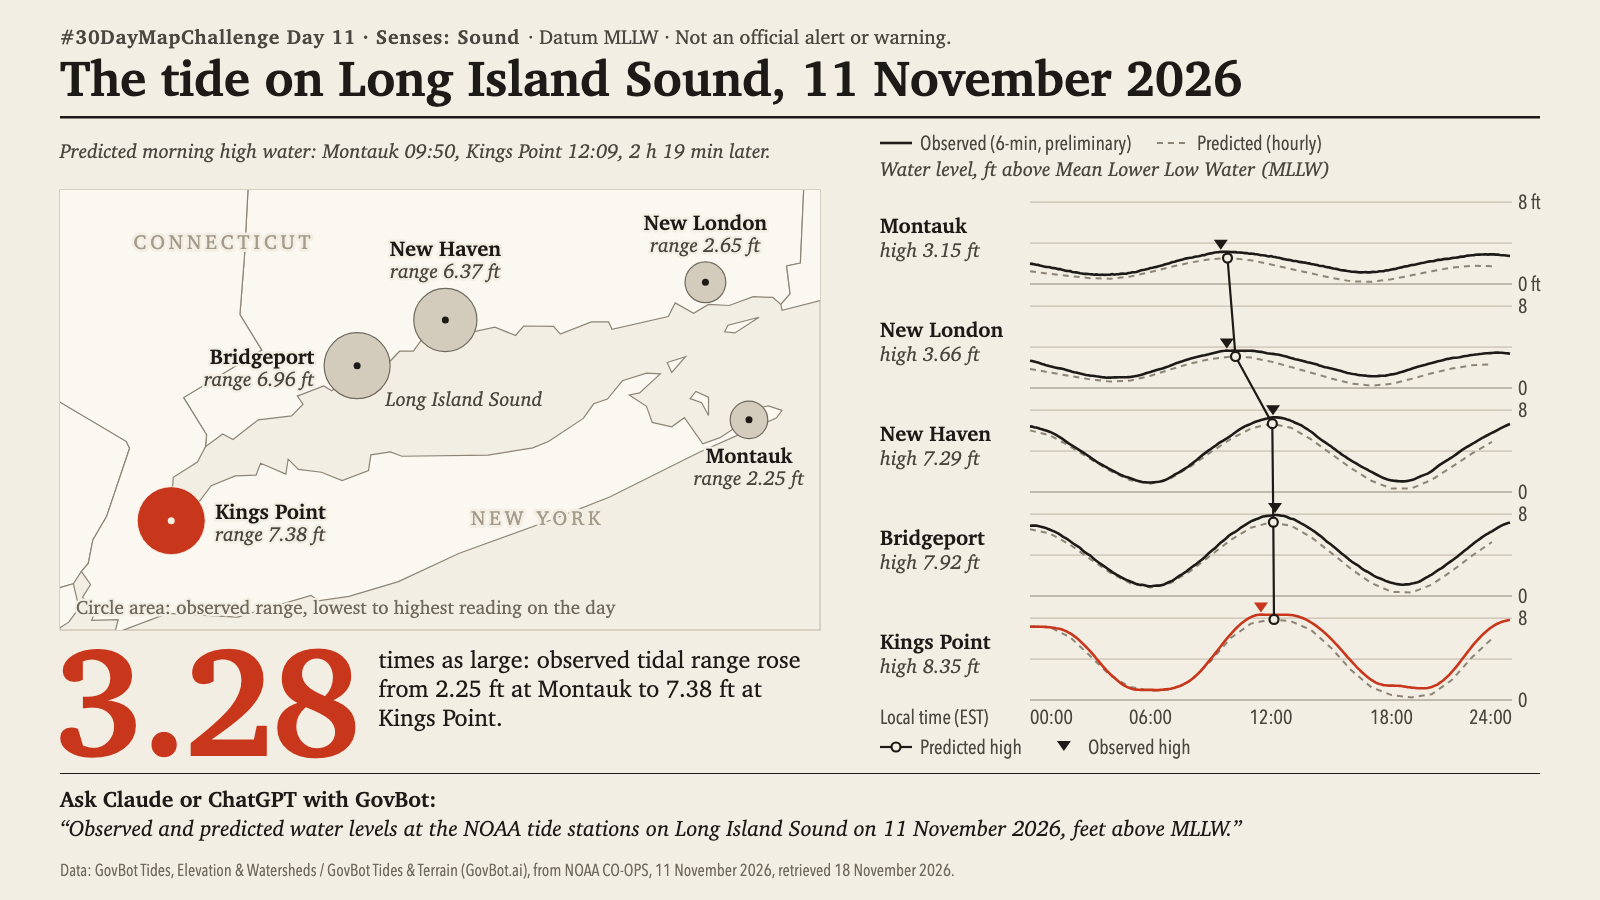
Print layout on a cream ground. Map of Long Island Sound between Connecticut and Long Island, New York, with five NOAA tide stations drawn as grey circles sized by observed tidal range on 11 November 2026, the westernmost, Kings Point, in vermilion: Montauk 2.25 ft, New London 2.65 ft, New Haven 6.37 ft, Bridgeport 6.96 ft, Kings Point 7.38 ft. The headline figure, 3.28 in large vermilion type, reads: times as large; observed tidal range rose from 2.25 ft at Montauk to 7.38 ft at Kings Point. Beside the map, one water-level curve per station from east to west, in feet above Mean Lower Low Water over the local day (EST): observed six-minute values as a solid line, hourly predictions as a dashed line, with a line joining the predicted high waters. Highs: Montauk 3.15 ft, New London 3.66, New Haven 7.29, Bridgeport 7.92, Kings Point 8.35. A subtitle gives the predicted morning high water as Montauk 09:50 and Kings Point 12:09, 2 h 19 min later. Printed: Datum MLLW; Not an official alert or warning.

Animation: one frame per six-minute observation at all five stations; no value is interpolated. Disc area is the reading above the day's lowest, and the disc meets its ring at the day's highest. 17 seconds, with sound; the player starts muted. Still image · Animation file (MP4)
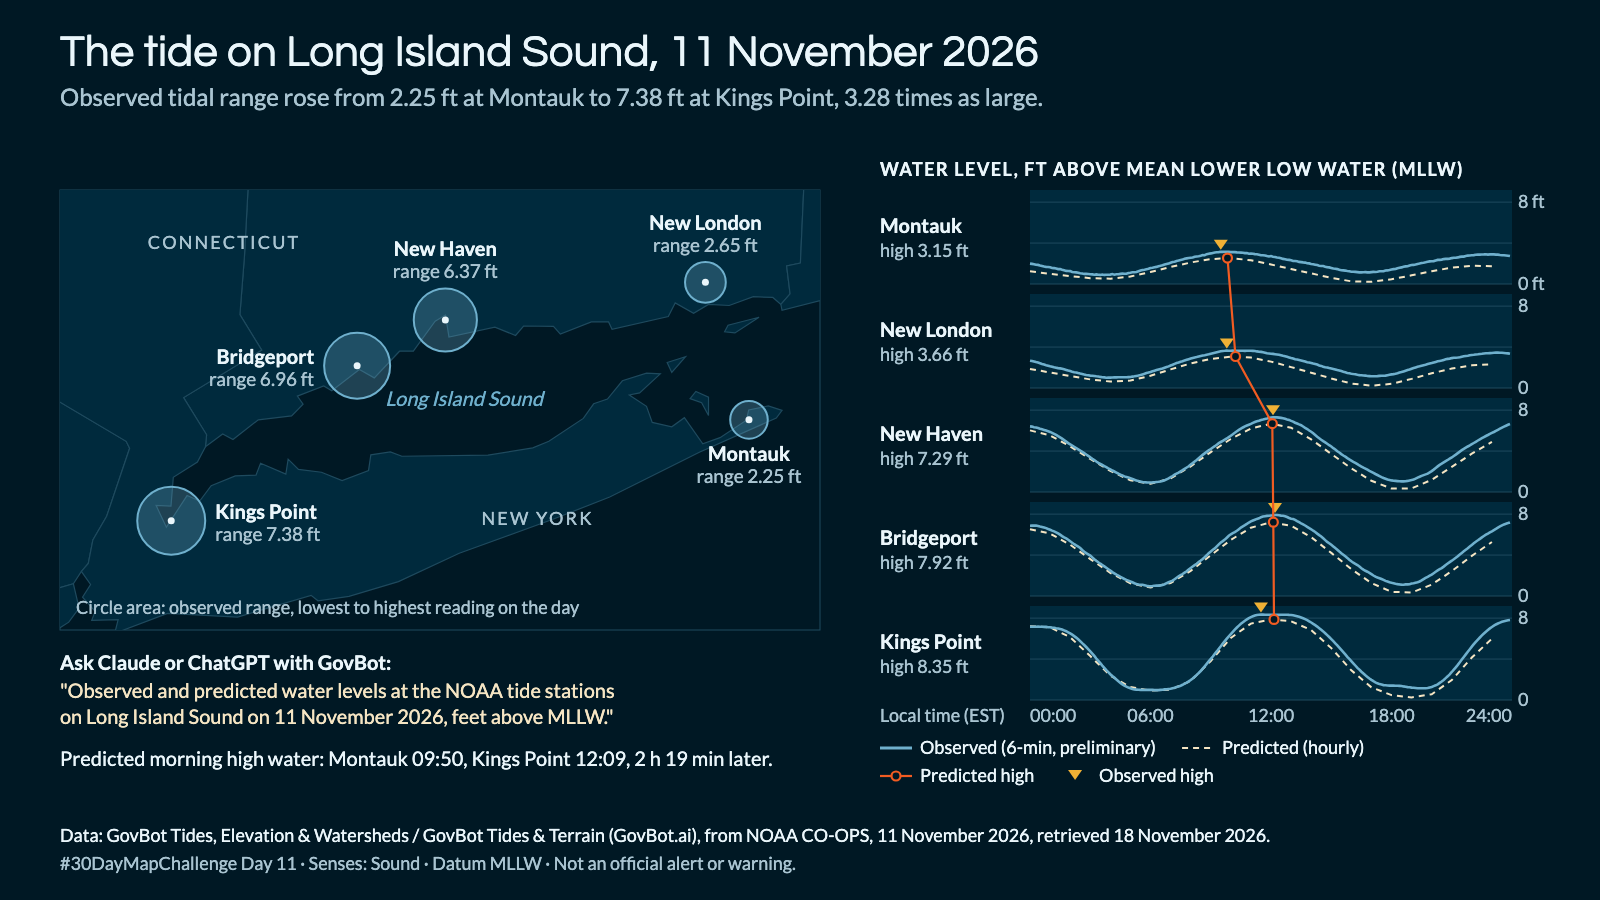
Animation: one frame per six-minute observation at all five stations; no value is interpolated. Disc area is the reading above the day's lowest, and the disc meets its ring at the day's highest. 17 seconds, with sound; the player starts muted. Still image · Animation file (MP4)

What were the observed and predicted water levels, in feet above MLLW, at the NOAA tide stations on Long Island Sound on 11 November 2026?

In Claude, add "GovBot Tides, Elevation & Watersheds"; in ChatGPT, add "GovBot Tides & Terrain" once, then turn it on in the chat. Every listing is at govbot.ai.

Data: GovBot Tides, Elevation & Watersheds / GovBot Tides & Terrain (GovBot.ai), from NOAA CO-OPS, 11 November 2026, retrieved 18 November 2026.

How it was made: Data from the GovBot listing named above; map made with Claude, an AI model, and reviewed before publication. The animation shows the same records as the still image, and begins and ends on it.

Add it once

Claude: Settings, Connectors, then the GovBot listing in the connector directory. ChatGPT: search the plugin directory for the GovBot listing.

Turn it on in the chat

In Claude, switch the listing on in the chat. In ChatGPT, type @ in a new chat and choose it. Developers can use the same Claude listings in Claude Code.

Ask in plain language

Ask in plain language. Check the sources, record dates and stated limits in the answer.