#30DayMapChallenge · Day 12 · Power · Thursday 12 November 2026
Power in Texas: generating capacity by fuel
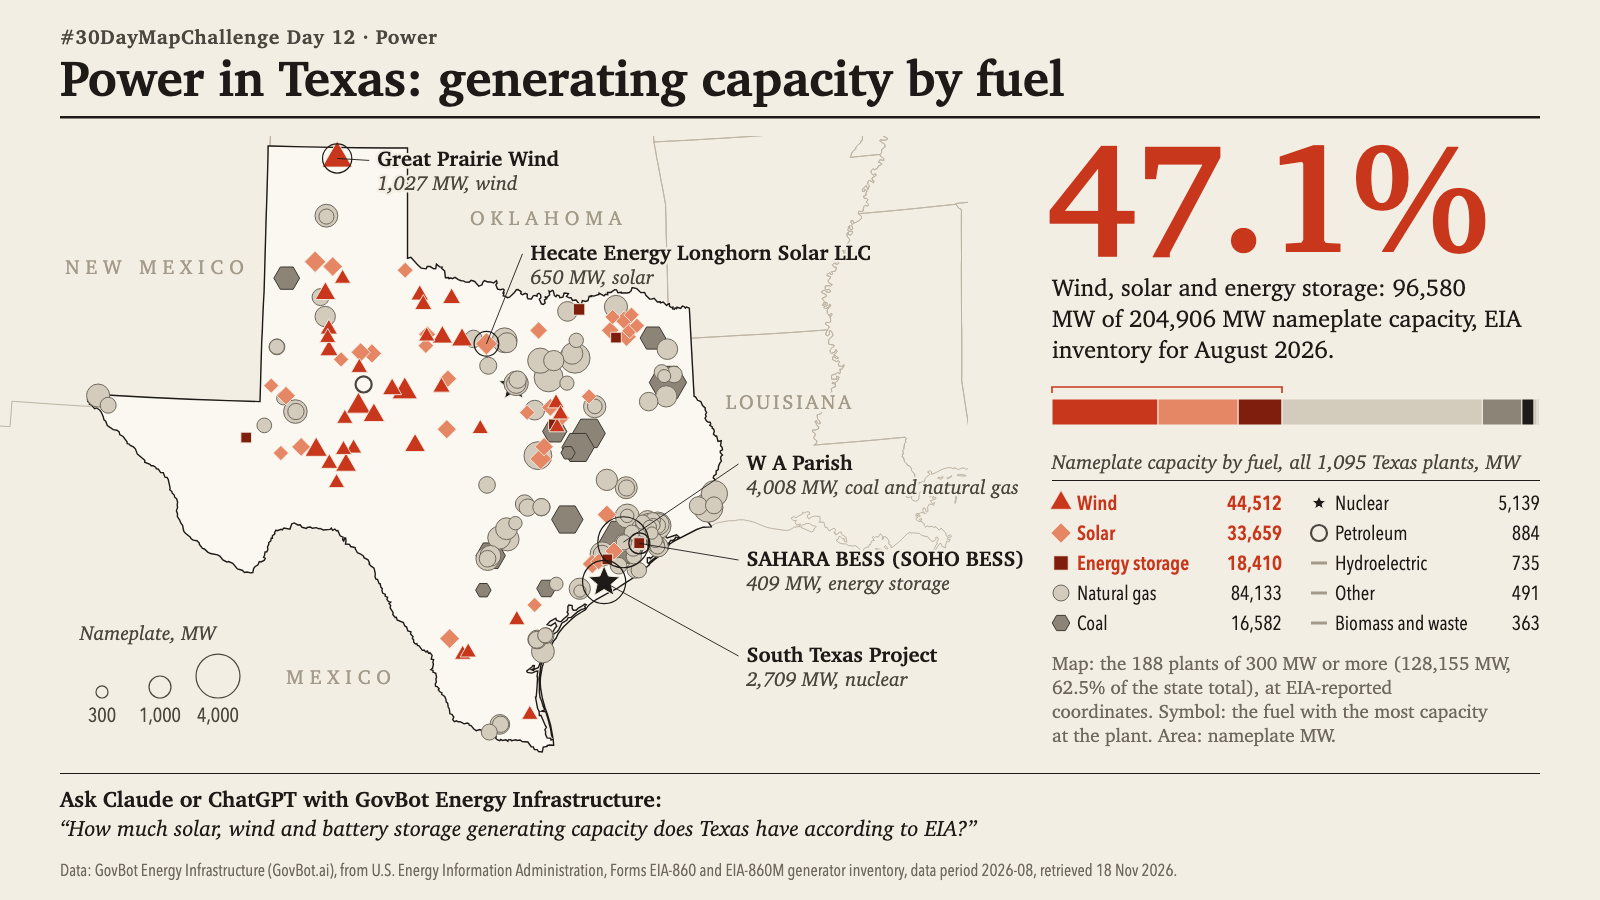
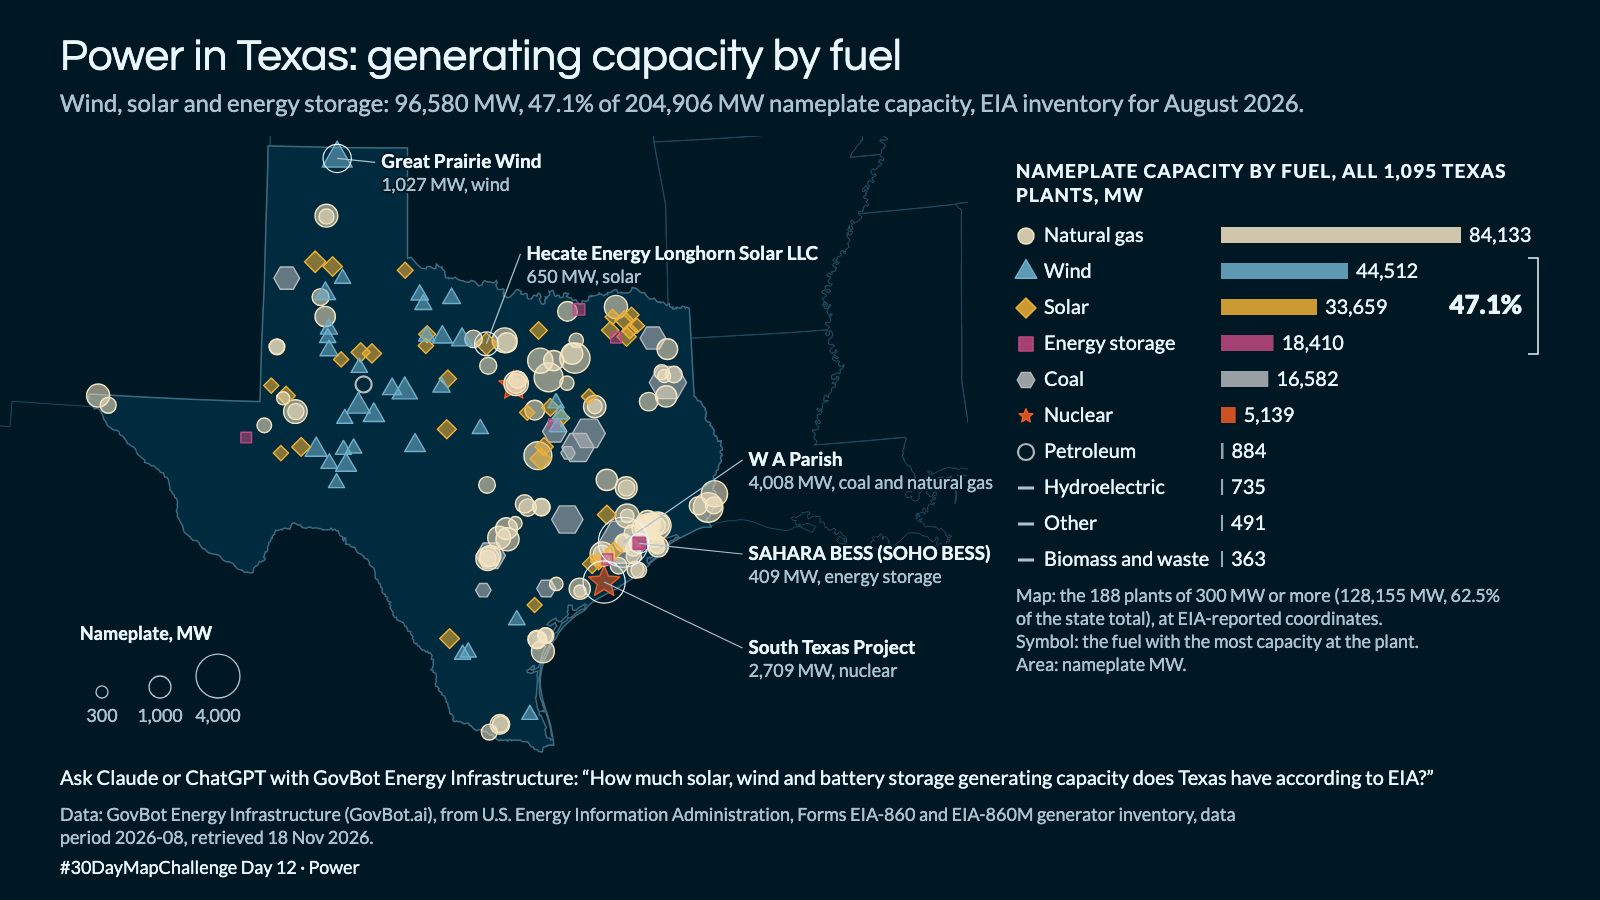
Animation: the plants appear fuel by fuel in the order of the capacity list, largest plant first. The order is a reading order, not a sequence in time; nothing moves. 21 seconds, with sound; the player starts muted. Still image · Animation file (MP4)
Animation: the plants appear fuel by fuel in the order of the capacity list, largest plant first. The order is a reading order, not a sequence in time; nothing moves. 21 seconds, with sound; the player starts muted. Still image · Animation file (MP4)
How much solar, wind and battery storage generating capacity does Texas have according to EIA?
In Claude, add "GovBot Energy Infrastructure"; in ChatGPT, add "GovBot Energy Infrastructure" once, then turn it on in the chat. Every listing is at govbot.ai.
Data: GovBot Energy Infrastructure (GovBot.ai), from U.S. Energy Information Administration, Forms EIA-860 and EIA-860M generator inventory, data period 2026-08, retrieved 18 Nov 2026.
How it was made: Data from the GovBot listing named above; map made with Claude, an AI model, and reviewed before publication. The animation shows the same records as the still image, and begins and ends on it.